

A revenue target tells you where the year should end. It says nothing about the route. The method below takes a target and works it down to the calls, meetings and proposals each week has to hold.
It is the method in A working sales plan, a free guide with an Excel workbook. The figures come from the guide's worked example: MyWidget Oy, a fictitious Finnish company that sells widgets to process and manufacturing companies. The company is invented. The arithmetic is the same for anyone.
Before you start
Gather these figures for the previous financial year. If the year has not closed yet, use your best estimate and correct it when the accounts are final.
- Revenue, split into forward orders, existing business, share-of-wallet growth and new-customer sales
- The revenue you lost to churn
- The average value of a deal with a new customer
- The conversion rates between the stages of your sales process, if you record them
- Your revenue targets for the next 3 years
Step 1: write the growth intent in one sentence
What does your organisation want to achieve in its market over the next 3 years? Name the market and the date. MyWidget's reads:
Become a top-quartile supplier of widgets in southern Finland by the end of 2027, and in 8 neighbouring markets by the end of 2029: Sweden, Norway, Denmark, Germany, Poland, Estonia, Latvia and Lithuania.
Everything that follows has to serve that sentence.
Step 2: build the revenue bridge
The revenue bridge takes the target for a year and works out how much of it has to come from new customers.
| MyWidget Oy, 2027, in euros | |
|---|---|
| Revenue target | 6,000,000 |
| Less forward orders | 850,000 |
| Less existing business | 3,000,000 |
| Plus churn | 450,000 |
| Less share-of-wallet growth | 900,000 |
| Equals new-customer sales | 1,700,000 |
Forward orders are sales closed in one year and booked in the next. Existing business is revenue from existing customers that you can reliably count on: recurring revenue, contracts, repeat orders. If you are in any doubt about a line, leave it out. Churn is added back, because revenue that leaves has to be replaced. Share-of-wallet growth is what existing accounts will add.
The result, new-customer sales, is only as reliable as the lines above it.
Step 3: turn new-customer sales into deals
Divide new-customer sales by the average deal size. For MyWidget, €1,700,000 divided by €275,000 is 6.2 deals.
You cannot close a fifth of a deal, and a plan for 6 when the arithmetic says 6.2 is a plan to fall short. Plan for the next whole deal up.
Then read the deals line across the years, because it shows which assumptions the plan rests on. Between 2028 and 2029, MyWidget's revenue target rises by €2.75 million, yet the deals required rise by only about 1, because the average deal is expected to grow from €325,000 to €400,000. That one assumption carries a good part of the plan. If it does not hold, every activity figure that follows is too low.
Step 4: work back through the conversion rates
Conversion rates turn the deals into the activity that comes before them.
| New business, 2027 | Converts to the row above | Year | Week |
|---|---|---|---|
| Deals required | 6.2 | 0.14 | |
| Proposals presented | 50% | 12 | 0.28 |
| Exploration meetings | 50% | 25 | 0.56 |
| Prospecting calls | 33% | 75 | 1.70 |
To win just over 6 new customers, MyWidget needs about 75 prospecting calls, 25 exploration meetings and 12 proposals in the year. That is fewer than 2 prospecting calls a week.
The rates have to describe how your team actually performs. Rates copied from a benchmark, or from an unusually good year, produce a comfortable plan and an uncomfortable fourth quarter. If you do not track them yet, estimate them, write down that they are estimates, and replace them with what actually happened after one quarter.
Step 5: plan account management separately
Existing customers need deals too: repeat orders, renewals that need a decision, and share-of-wallet growth. The activities have the same names, but the conversion rates are usually different, so they get their own plan.
The number of deals you need from existing customers is the one figure you have to estimate yourself. Start from last year's count, then adjust for the accounts you expect to grow or lose. MyWidget expects 17. At its rates of 60%, 60% and 45%, that takes 28 proposals, 47 exploration meetings and 105 prospecting calls in the year.
Step 6: set the selling weeks and read the week
Divide the year's activity by the weeks in which your team can actually sell. The workbook uses 44, which leaves 8 for annual leave, public holidays and quieter periods. If your customers are hard to reach for several weeks in summer, lower it.
With new business and account management together, MyWidget's plan asks for about 4 prospecting calls, 1.6 exploration meetings and 0.9 proposals a week.
Those figures look small, and they are meant to. A plan that asks for 4 good conversations a week can be kept, and a shortfall shows up within a fortnight rather than at the end of the quarter.
Then: the next 90 days, and the market
The numbers say how much has to happen. The 90-day priorities say what will change in the next quarter to make it happen. Keep them to 5 or fewer, give each priority one owner and a date, and replace the list every quarter. "Increase focus on prospecting" cannot be checked on 31 March. "Hold at least 2 new business prospecting calls a week, logged in the CRM" can.
Underneath it all sits the market strategy: up to 3 target markets, who decides in each, the problems you solve and what you say about them. If that part is vague, the activity numbers can be right and the activity will still miss. If you have not yet written down which organisations you serve best, The ideal client profile is a working filter for that job. If the prospecting line looks hard to fill, A guide to sales prospecting covers finding, qualifying and approaching buyers in European B2B markets.
What moves the number
Once your own figures are in, change one input at a time and watch the prospecting calls. It shows quickly which assumptions the plan depends on.
| Change to MyWidget's 2027 plan | New business deals | Prospecting calls a year |
|---|---|---|
| No change | 6.2 | 75 |
| Churn doubles, from €450,000 to €900,000 | 7.8 | 95 |
| Share-of-wallet growth rises by €200,000 | 5.5 | 66 |
| Average deal size rises by 10% | 5.6 | 68 |
| Proposal-to-deal rate rises from 50% to 60% | 6.2 | 62 |
| Call-to-meeting rate rises from 33% to 40% | 6.2 | 62 |
In this example, losing another €450,000 to churn adds 20 prospecting calls a year, more than any single improvement saves. It is worth finding out whether the same is true of your own plan.
Get the guide and workbook
A working sales plan covers all 4 parts of the plan: the revenue bridge, the activity, 90-day priorities and market strategy. The Excel workbook opens on the MyWidget example, so you can follow it line by line before you enter your own figures. Both are free: Get the guide and workbook.
If you get stuck, or the numbers tell you something you did not expect, send me your first pass and we will look at it together.
Related
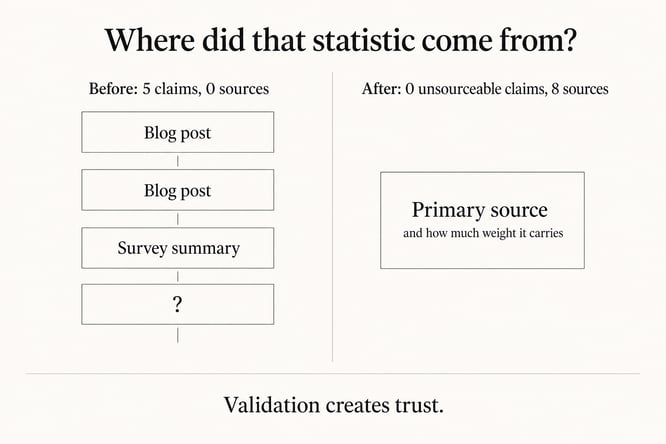
Five statistics I deleted from my own guide
In "customer acquisition", "prospecting effectiveness", "competitive advantage", "sales effectiveness"

The pitch I turned down...
In "customer acquisition", "prospecting effectiveness", "competitive advantage", "sales effectiveness", "adding value", "pipeline management", "opportunity management"

Sharper reps, later in the conversation
In "customer acquisition", "prospecting", "sales effectiveness"